# Module 19: Growth Models

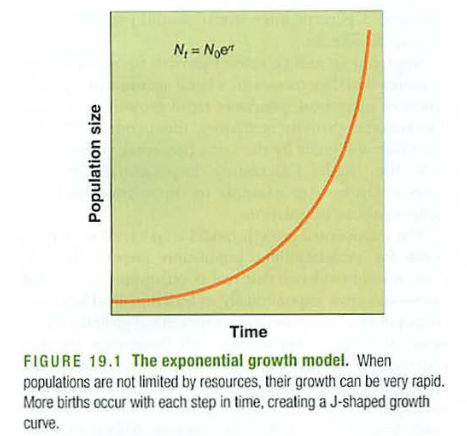
<span style="font-weight: bold;">Module 19: growth models</span>Imagine you are a happy bacteria, or rabbit, with lots of food, land and no predators. Your population growth curve might look like this:
<div class="sandbox" id="bkmrk-"><div id="bkmrk--1"><div id="bkmrk--2"><div><div class="container"><div class="frontside"><div class="iframe">![](http://physics.hpa.edu/groups/apenvironmentalscience/weblog/5923f/images/b58a6.png "Screen Shot 2017-10-07 at 7.51.12 AM.png")</div></div></div></div></div></div></div>  
This is called exponential growth, or "J shaped growth"Note that it has no end, or limiting factor.  
Small r is the growth rate. If you have had physics (yay!) this is usually "k" in some examples, or related to RC decay/growth.Learning this equation is VERY useful.Note that it depends on two things: the starting amount in the population (No) and the growth rate (r)Here is an example:<div class="sandbox" id="bkmrk--5"><div id="bkmrk--6"><div id="bkmrk--7"><div><div class="container"><div class="frontside"><div class="iframe">![](http://physics.hpa.edu/groups/apenvironmentalscience/weblog/5923f/images/__thumbs__/b6c99.png)</div></div></div></div></div></div></div>  
You might also find this link useful:[https://www.khanacademy.org/science/ap-biology/ecology-ap/population-ecology-ap/a/exponential-logistic-growth](https://www.khanacademy.org/science/ap-biology/ecology-ap/population-ecology-ap/a/exponential-logistic-growth)  
  
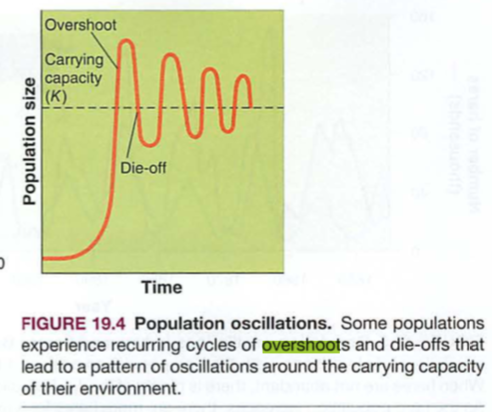
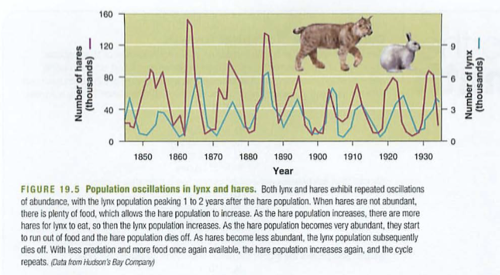
Many systems follow J shaped exponential growth until they run out of food or space, then there is overshoot and die-off:<div class="sandbox" id="bkmrk--11"><div id="bkmrk--12"><div id="bkmrk--13"><div><div class="container"><div class="frontside"><div class="iframe">![](http://physics.hpa.edu/groups/apenvironmentalscience/weblog/219f0/images/cfee2.png "Screen Shot 2020-10-08 at 5.50.26 PM.png")</div></div></div></div></div></div></div>  
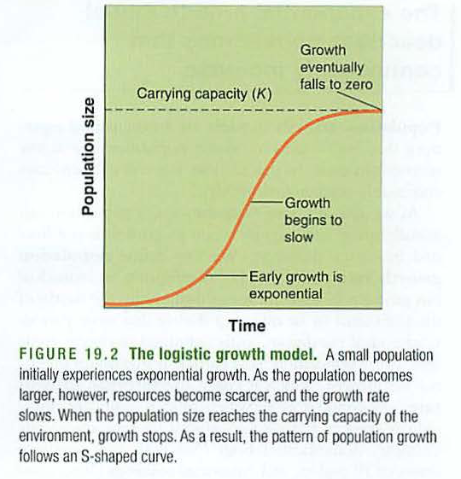
A more ideal version of this is the S shaped curve, called logistic growth:  
<div class="sandbox" id="bkmrk--16"><div id="bkmrk--17"><div id="bkmrk--18"><div><div class="container"><div class="frontside"><div class="iframe">![](http://physics.hpa.edu/groups/apenvironmentalscience/weblog/5923f/images/c21b6.png "Screen Shot 2017-10-07 at 7.56.18 AM.png")</div></div></div></div></div></div></div>  
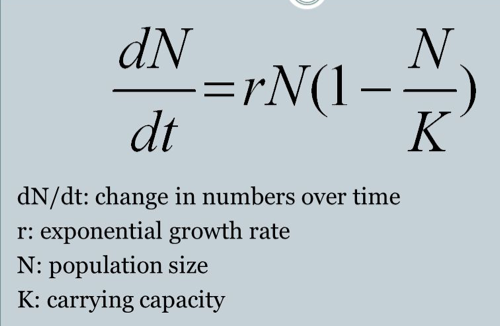
Here is a formula for logistic growth that we'll discuss:  
<div class="sandbox" id="bkmrk--21"><div id="bkmrk--22"><div id="bkmrk--23"><div><div class="container"><div class="frontside"><div class="iframe">![](http://physics.hpa.edu/groups/apenvironmentalscience/weblog/5923f/images/__thumbs__/a5164.png)</div></div></div></div></div></div></div>Don't be intimidated by this formula...dN/dt is just delta N over delta t, or the ∆ in number over the ∆ in time, (∆ means change)or the rate of population growth (some of you may see this as the slope of the S curve)Note that when the ratio N/K is very small or close to zero, the stuff in the parentheses becomes 1, so the formula is rate = rN, or J curved exponential growth.

Recall: J curved exponential growth only depends on starting population and reproductive rate.

  
As N/K nears one (number of critters equals carrying capacity) the term in the parentheses becomes zero, so no growth.

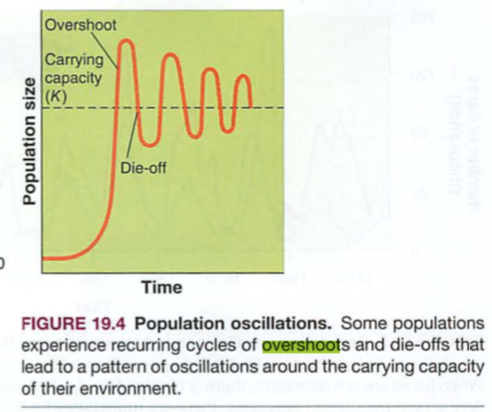
Note also that if N/K is GREATER than one, the growth rate (slope of the curve) become negative. This is overshoot and die off.

<div class="sandbox" id="bkmrk--25"><div id="bkmrk--26"><div id="bkmrk--27"><div><div class="container"><div class="frontside"><div class="iframe">![](http://physics.hpa.edu/groups/apenvironmentalscience/weblog/219f0/images/ed5ae.png "Screen Shot 2020-10-08 at 5.50.26 PM.png")</div></div></div></div></div></div></div>  
  
------<span style="font-weight: bold;">Logistic growth worksheet</span>

<span style="font-weight: bold;">First: exponential growth:</span>

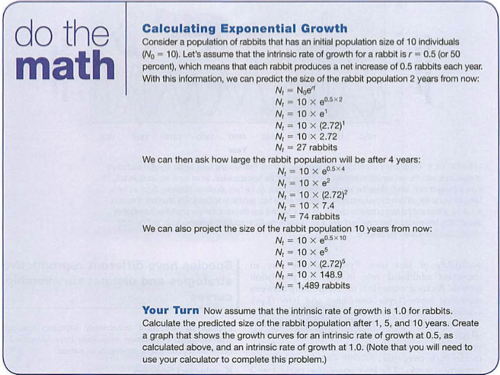
Imagine 10 imaginary rabbits (No=10)

Assume r = 0.5 (50 percent growth rate, or each rabbit makes 0.5 rabbits per year)

Find the population 2 years later:

Nt = Noe^rt

Nt = 10e^0.5\*2

Nt = 27 rabbits

After 4 years:

After 10 years:

———

<span style="font-weight: bold;">Next, use the logistic growth formula, same data, with a carrying capacity (K) of 100:</span>

Small population: 10 rabbits

∆N/∆t = rN(1-N/K)

= 0.5\*10(1-10/100)

= 5(1-0.1)

= 5(0.9)

= 4.5 rabbits per year

<span style="font-weight: bold;">Find the rabbits per year for these populations:</span>

Medium population: 27 rabbits

Near K: 74 rabbits

Above K: 1489 rabbits

<span style="font-weight: bold;">quiz</span> (you may use <span style="font-weight: bold;">your</span> worksheet only)

1. 30 rabbits live on an island with carrying capacity 200. They reproduce at a rate of 0.5 per year. How many rabbits will be on the island after 3 years? (hint: you would do the calculation three times-this is only an estimate though, the true formula would be a bit more complex)
2. What will be the slope of the growth curve at this point?

<span id="bkmrk-next%3A-predator%2Fprey-" style="font-weight: bold;">Next: predator/prey phase diagrams</span>Check this out:  
<div class="sandbox" id="bkmrk--31"><div id="bkmrk--32"><div id="bkmrk--33"><div><div class="container"><div class="frontside"><div class="iframe">![](http://physics.hpa.edu/groups/apenvironmentalscience/weblog/5923f/images/__thumbs__/9fec6.png)</div></div></div></div></div></div></div>Note the phase (timing) relationship between the abundance of the food and the population of the prey, then the predator.  
<span id="bkmrk-predator-prey-lab%3A" style="font-weight: bold;">Predator Prey Lab:</span>  
<div id="bkmrk-download-predator-pr">[Download predator-prey-simulation12.pdf (application/pdf, 203.7 KB)](https://bookstack.kamuela.org/attachments/46)

  
<span><div><span style="font-weight: bold;">The big steps:</span>  
1. Draw out a biome on your table, using dry erase markers (no permanent, please), about 60cm xx 60 cm  
2. Distribute 3 rabbits on your biome  
3. Drop a lynx on your biome. If it “eats” three rabbits, then add another lynx to the simulation. If it does not, remove that lynx  
4. Double the number of rabbits, and drop a new lynx on your biome. If it eats 3 rabbits it reproduces. One new lynx kitten for every 3 rabbits.  
5. Repeat 25 times, record the number of rabbits and lynxes after each generation, look for patterns</div></span><span></span>  
Population growth worksheet: (uses Numbers application)</div><div id="bkmrk-download-population-">[Download Population Growth Model.numbers (text/html, 740.6 KB)](https://bookstack.kamuela.org/attachments/47)

Worksheet: excel version:</div><div id="bkmrk-download-population--1">[Download Population Growth Model.xls (text/html, 61.5 KB)](https://bookstack.kamuela.org/attachments/48)

Simulation:  

[Download ESI-24-modeling\_population\_growth.pdf (application/pdf, 14.0 KB)](https://bookstack.kamuela.org/attachments/49)

</div><div id="bkmrk-questions%3Anow-we-can">Questions:  
  
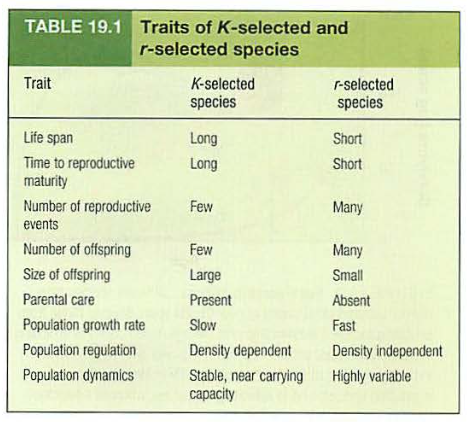
Now we can discuss generalizations of r and K strategists:Note: r comes from small r (growth rate) in the growth formula, while K comes from large K in the same formula (carrying capacity):<div class="sandbox" id="bkmrk--36"><div id="bkmrk--37"><div id="bkmrk--38"><div><div class="container"><div class="frontside"><div class="iframe">![](http://physics.hpa.edu/groups/apenvironmentalscience/weblog/5923f/images/75cba.png "Screen Shot 2017-10-07 at 8.05.23 AM.png")</div></div></div></div></div></div></div>Where do you fit in? How about Nemo?  
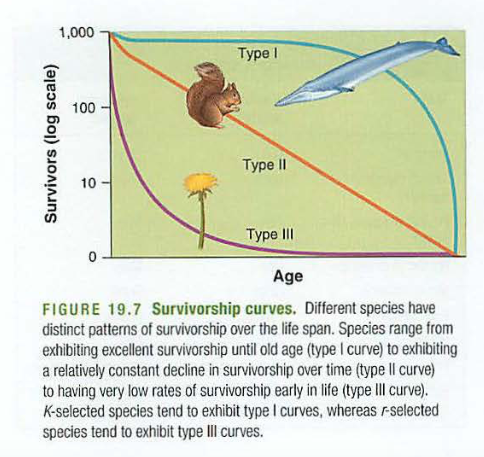
<div class="sandbox" id="bkmrk--39"><div id="bkmrk--40"><div id="bkmrk--41"><div><div class="container"><div class="frontside"><div class="iframe">![](http://physics.hpa.edu/groups/apenvironmentalscience/weblog/5923f/images/5e65e.png "Screen Shot 2017-10-07 at 8.05.41 AM.png")</div></div></div></div></div></div></div>Birds also fall into type II (no pun intended), as they randomly crash into stuff...There is a fourth type: deer. How would you imagine this curve?

<span style="font-weight: bold;">Related</span>:Another reason why genocides are so damaging to cultures: If an oral tradition (e.g. Hawaiians) are decimated by smallpox for example, it is the very old (the holders of the legends and history) and the very young (those who have time to listen, not work, and will then grow up and tell their kids) that are gone. This is a sort of cultural bottleneck...

</div>---

<small>Migrated from Apple Server Wiki. Original page ID: b0b6V4P9</small>