# Unit 9: Global Change: 4.57: Greenhouse gases
Link to text: Mods 55-59
[https://elab.hpa.edu/apes/texts/fr4e/unit%209-new.pdf](https://elab.hpa.edu/apes/texts/fr4e/unit%209-new.pdf)
Start with this graph from Mauna Loa: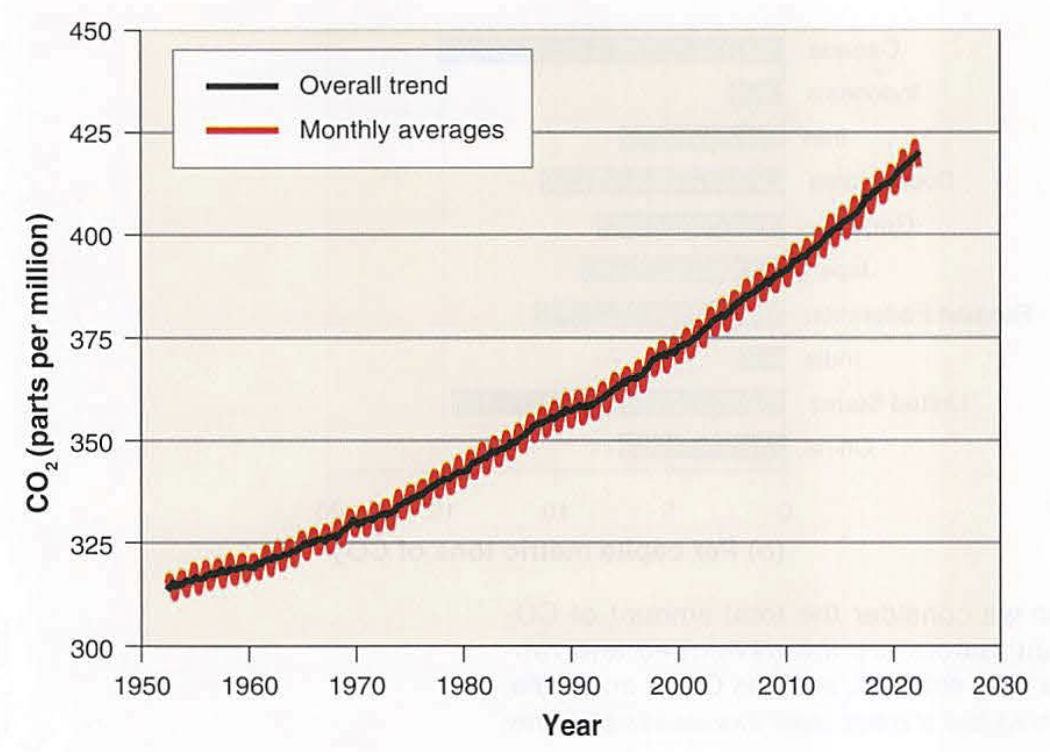Screenshot 2023-04-05 at 6.04.37 AM.png
- Seasonal variations are the little bumps, which represent our seasons in the northern hemisphere
- These would be reversed in the southern hemisphere
- Causes: photosynthesis uptakes carbon
- Pre-industrial level was 280 ppm
- Larger increase is about 1.6 ppm per year, so in 2008 when the elab was built, our CO2 sensors were calibrated as "normal" with 385 ppm.
- Today the average is around 440 ppm
- Check out the ppm today in the workshop: [http://10.14.20.1/](http://10.14.20.1/)
Sources:
Screenshot 2023-04-05 at 6.10.18 AM.png
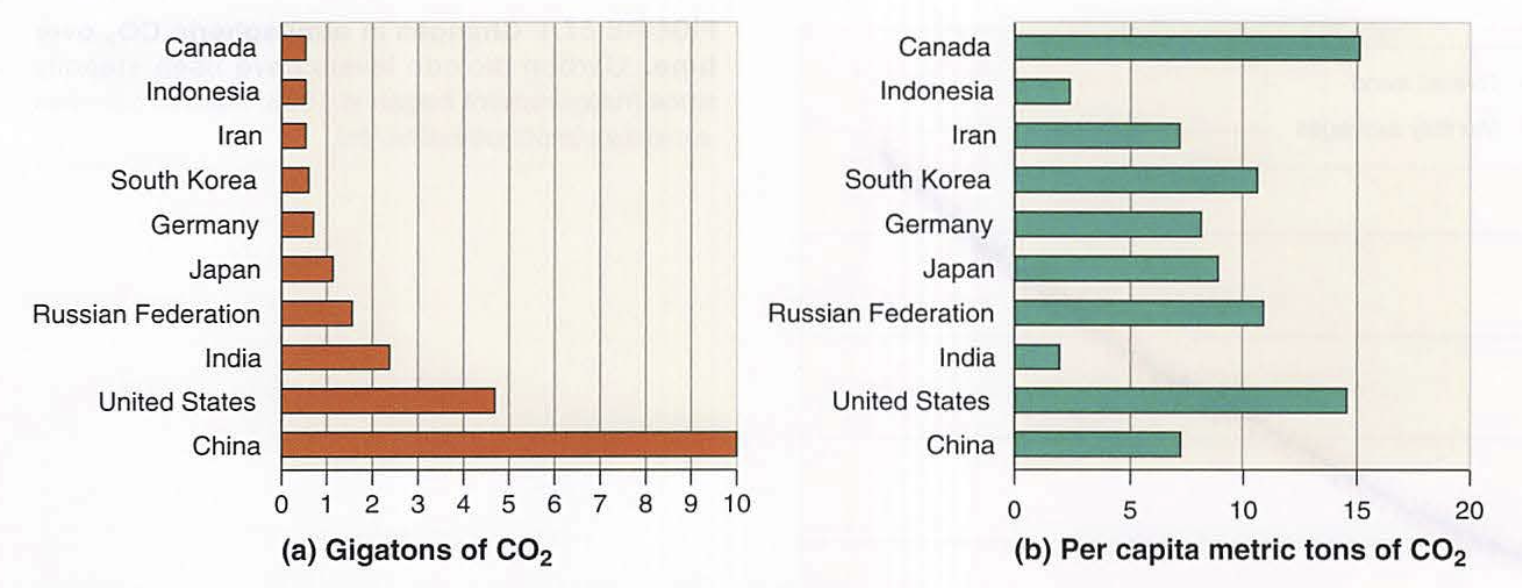
Notice the leading country (China) due to use of coal for energy
Notice also the leading per capita country (Canada) due to lower population
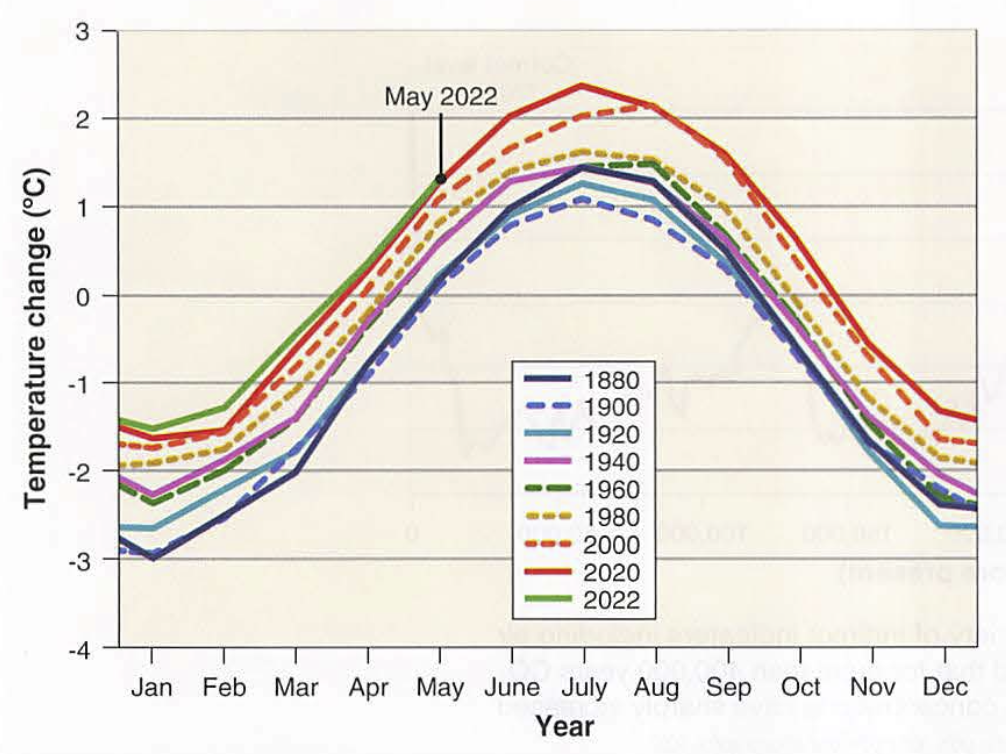
2024 was officially the hottest year on record, surpassing the previous record-holder, 2023, and the last 10 years have been the warmest 10 on record.
Annual increase:
Screenshot 2023-04-05 at 6.14.12 AM.png
Note we still have seasons, but the winters are warmer, the summers are hotter
So: more energy in the atmosphere, more water in gaseous form, so stronger storms, floods, hurricanes, [tornadoes](https://www.washingtonpost.com/weather/2023/04/02/tornadoes-climate-change/?utm_campaign=tempest-news-2023&utm_medium=email&_hsmi=253194624&_hsenc=p2ANqtz-8PRcFSDEw4vV2l70RLlJTmtquIatdDiToONPzKxBo056QxYdkJcNL-JxtG6EC7nfEnumYJ_FAbk1QFFMamF5pFoPsaVQ&utm_content=253194624&utm_source=hs_email)
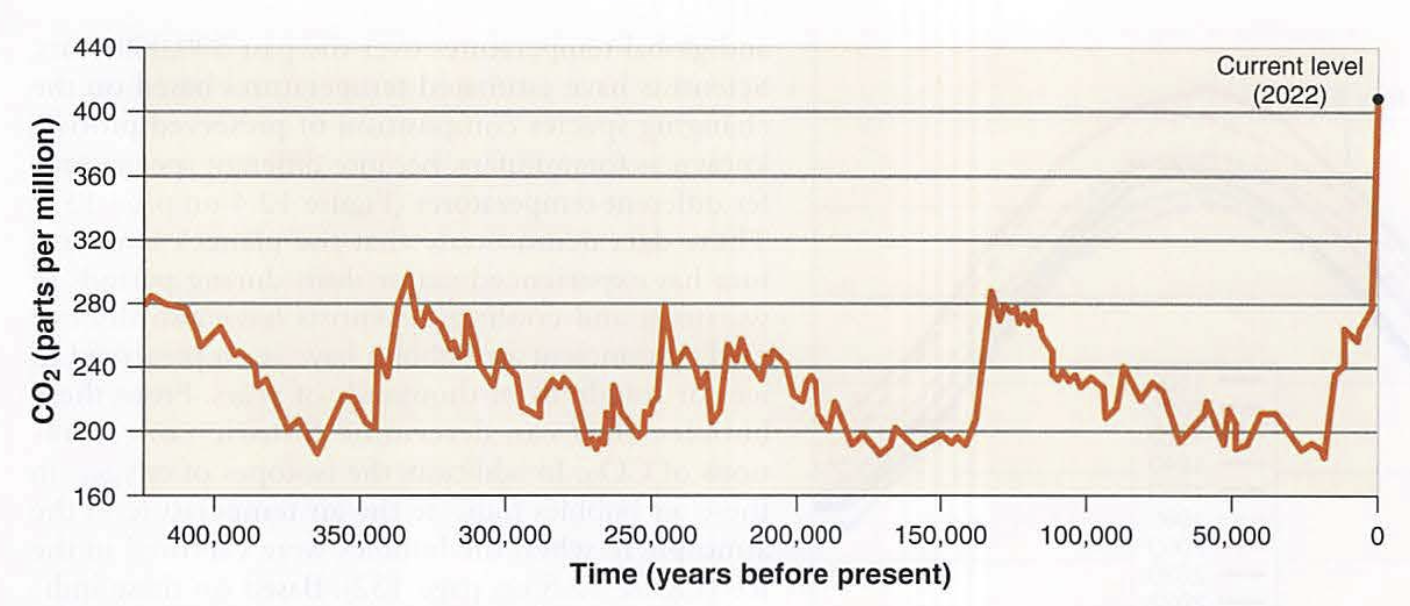
How do we know about long term trends?
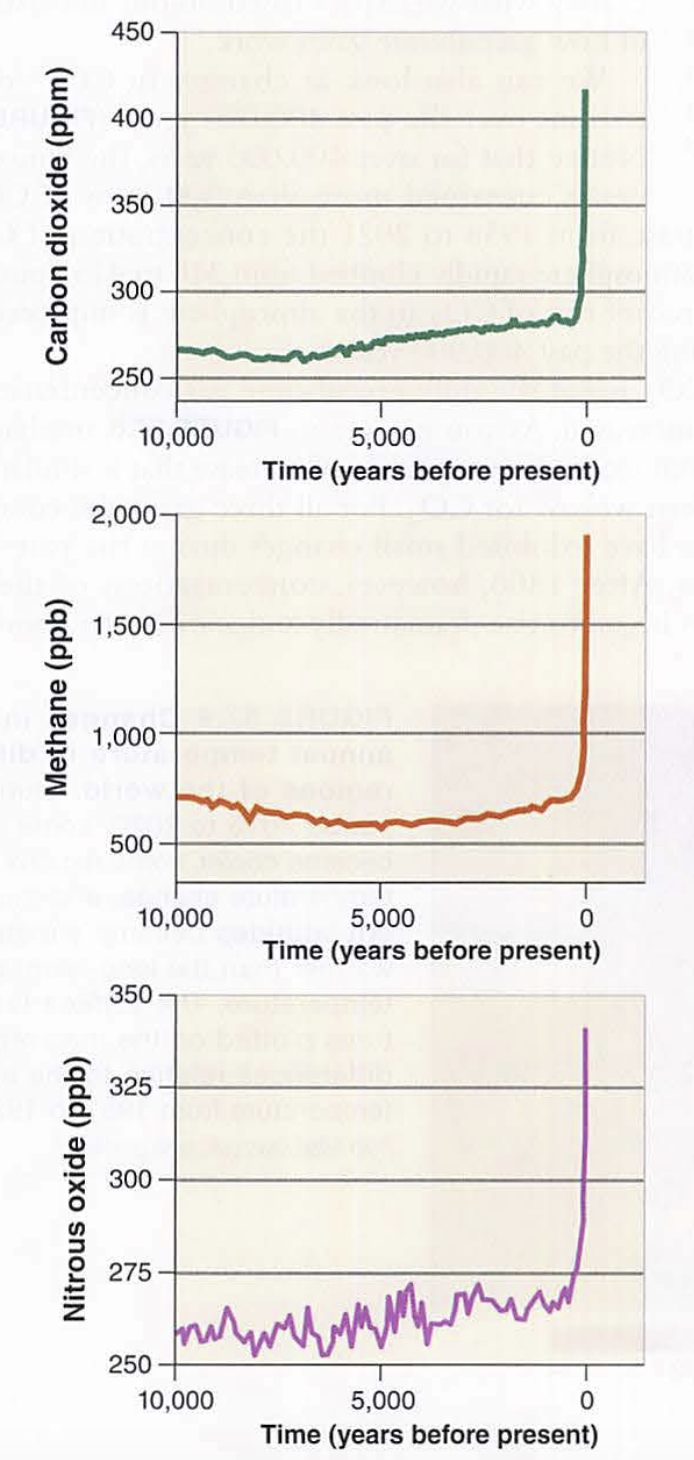
Ice cores from 500,000 years ago hold gas bubbles with CO2 levels intact, max was 300 ppm:
This is known as the "hockey stick" graph:
Screenshot 2023-04-05 at 6.17.50 AM.png
Other anthropogenic gases have also increased since the industrial revolution:
Screenshot 2023-04-05 at 6.18.46 AM.pngIncreased temp has a positive feedback loop:
1. increased greenhouse gases from anthropogenic sources
2. increased atmospheric and ocean temperatures
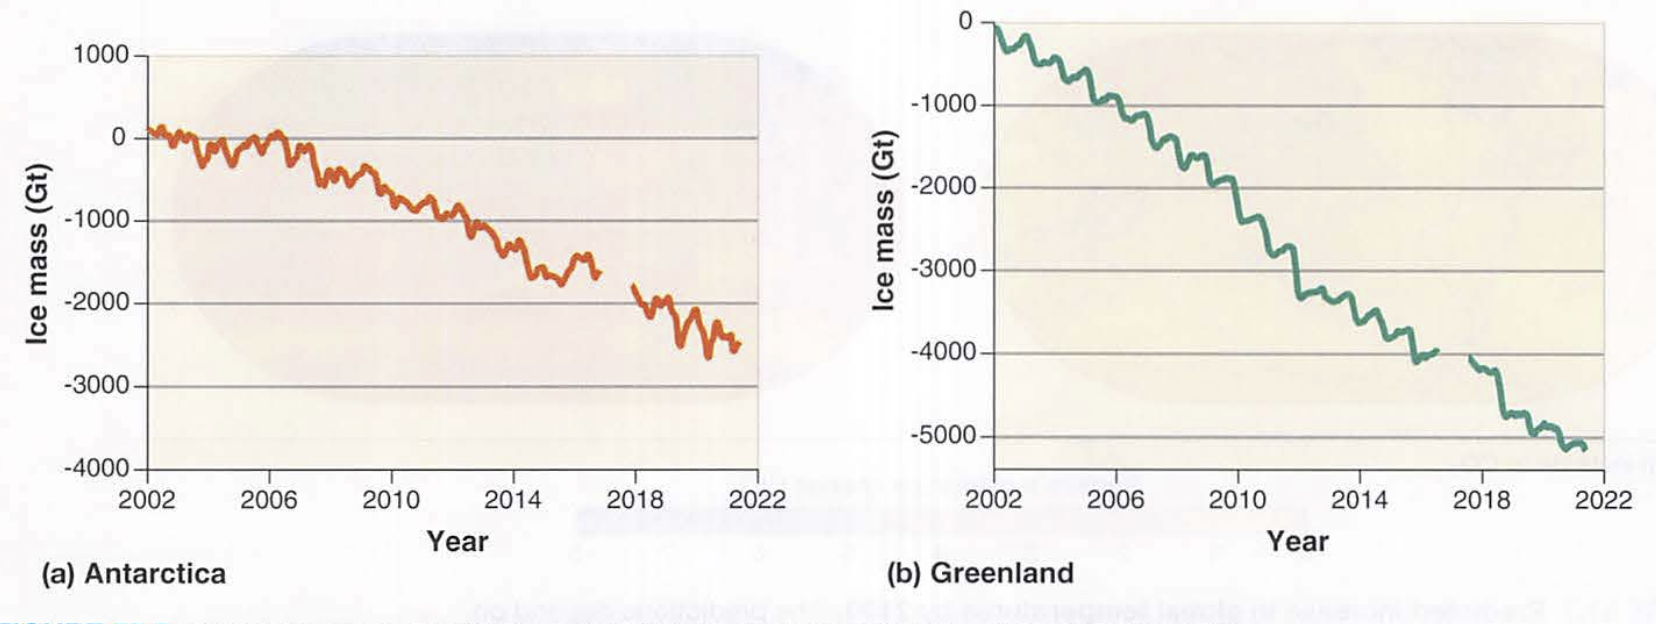
3. melting ice caps, lowers the "whiteness" or albedo of the planet
4. planet absorbs more heat
5. more ice melts
Screenshot 2023-04-05 at 6.25.33 AM.png
- There is a second more scary version of this with the permafrost:
- Recall that methane is about 44x as potent as a greenhouse gas
- Siberia, Canada and Alaska are covered with up to 1600 meters of frozen, un-decomposed plant matter called the permafrost (20% of the planet actually)
- As this melts, it will decompose anaerobically, releasing lots of methane.
- This is another positive feedback loop, and one reason we need to keep the global warming to under 2°C
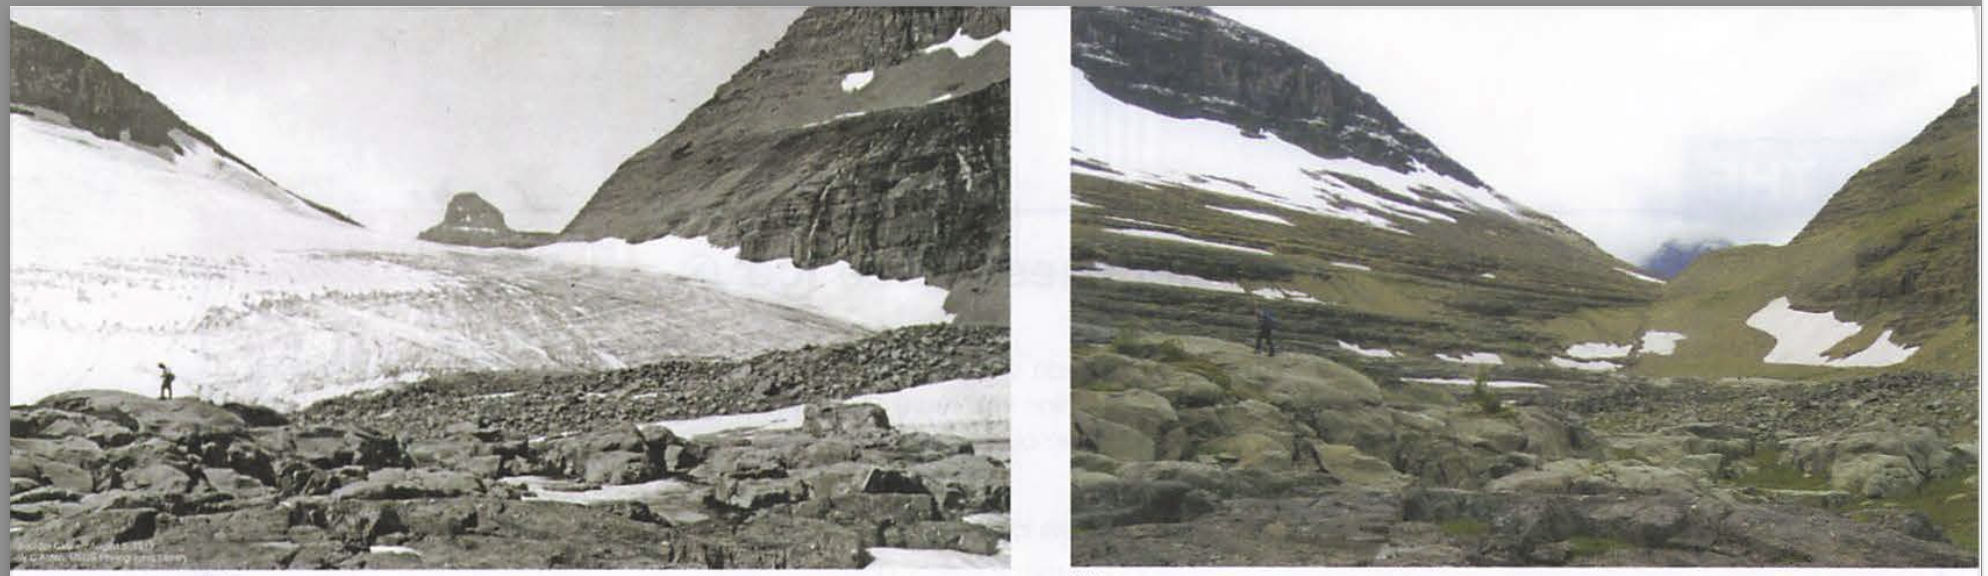
Glaciers are the "water towers for the world" where melting ice creates river flow in many rivers (e.g. Asia)
As these glaciers recede, the annual flow in the spring and summer will decrease, impacting farming.
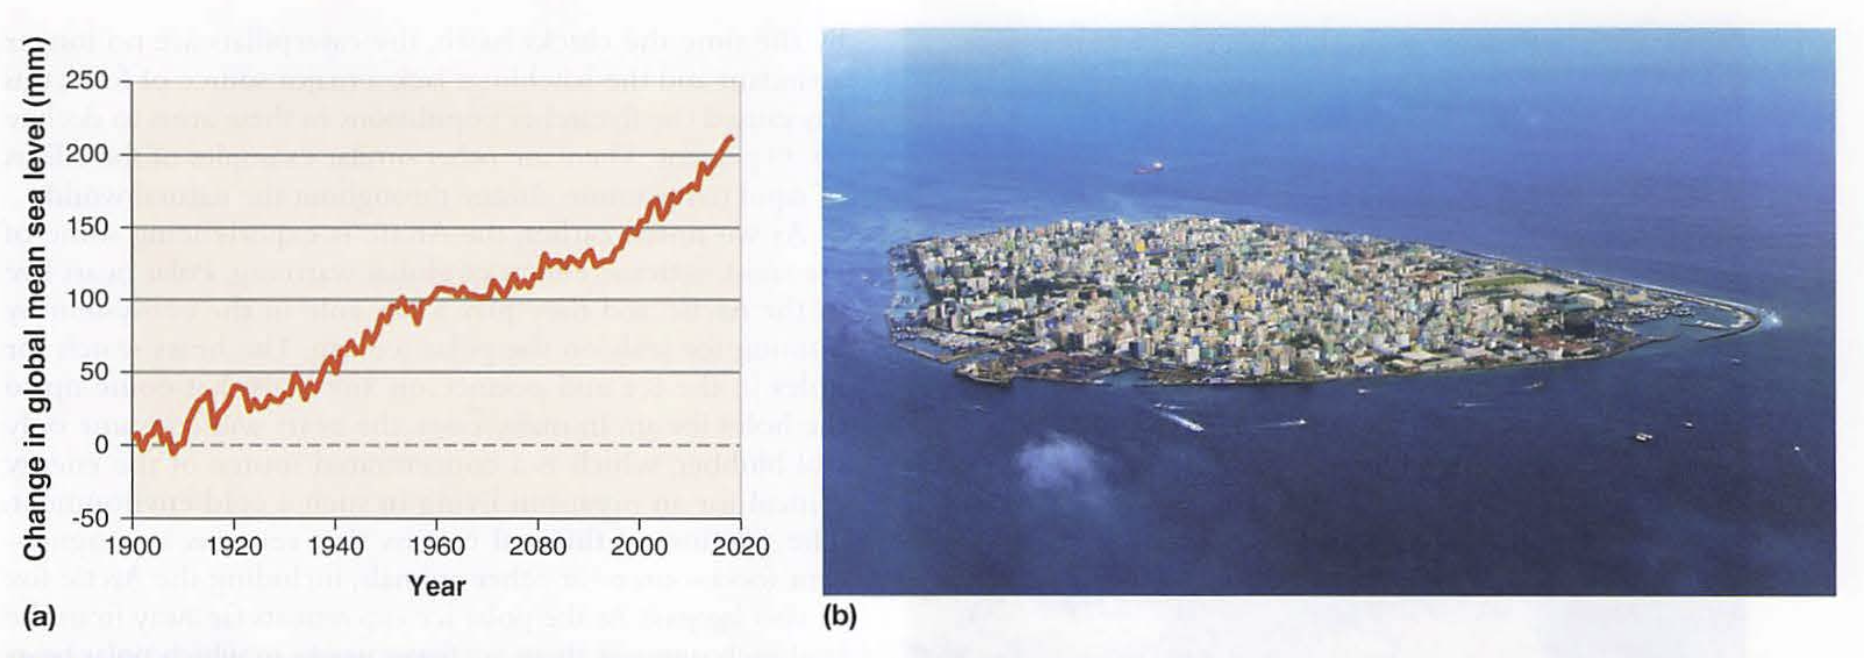
As the sea level rises, the amount of arable (farmable) land in low coastal areas will decrease due to salt water intrusion.
Combining these means less land and less water for farming, esp. in Asia
One reason China is buying lots of land in Africa...
Screenshot 2023-04-05 at 6.28.26 AM.png
Ocean currents may change: thermohaline current could cease, meaning freezing average temps for Europe
Sea levels will rise: melting ice plus expansion of warmer water
Screenshot 2023-04-05 at 6.32.57 AM.pngWhat can you do?
"Climate helplessness" is a common response
You are well informed, you understand cause and effect, and can make informed decisions for your future
You can also explain these concepts to others, changing the lives of others...
---
Migrated from Apple Server Wiki. Original page ID: w5A1w2J