Long ago, before clean water, health care and agriculture, CBR and CBR were about equal, so very low growth rate
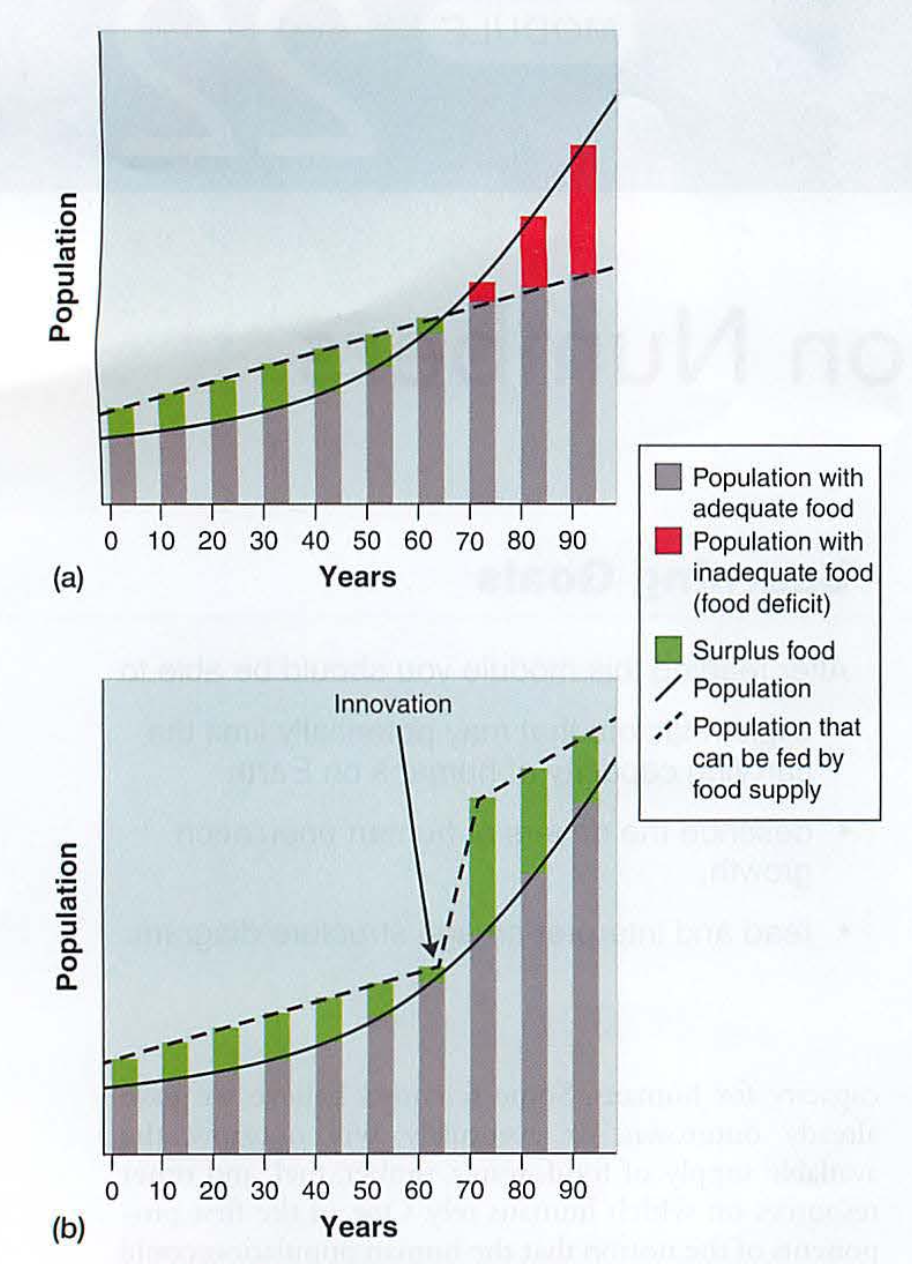
Malthus: Top graph
Screen Shot 2022-10-23 at 5.54.07 AM.png
A similar thing happened in the 1960's in Mexico, when population was increasing much faster than food supply, until Norman Borlaug created dwarf wheat, by creating a hybrid between heavy kernels and short stalks.
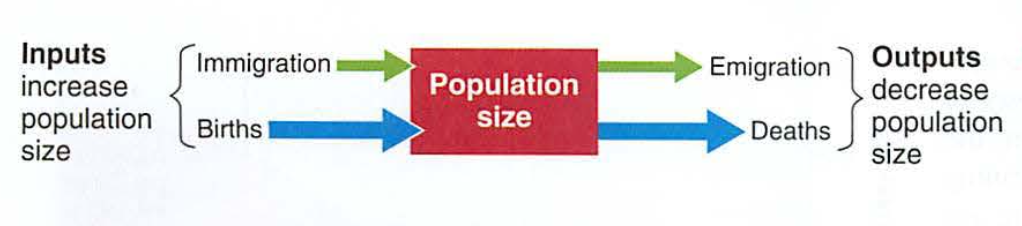
Population growth as a system: Inputs and outputs:
Screen Shot 2022-10-23 at 5.56.53 AM.png
Nations are a bit different: people can immigrate (come in) and emigrate (leave for somewhere else)
n.b. the global population stays the same, they are just moving around the planet
National model:
((CBR + Immigration) - (CDR + emigration))
10
Try this:
Doofania has a CBR of 12%, CDR of 4% with an immigration rate of 2% and emigration rate of 3%
What is the % growth rate for Doofania?
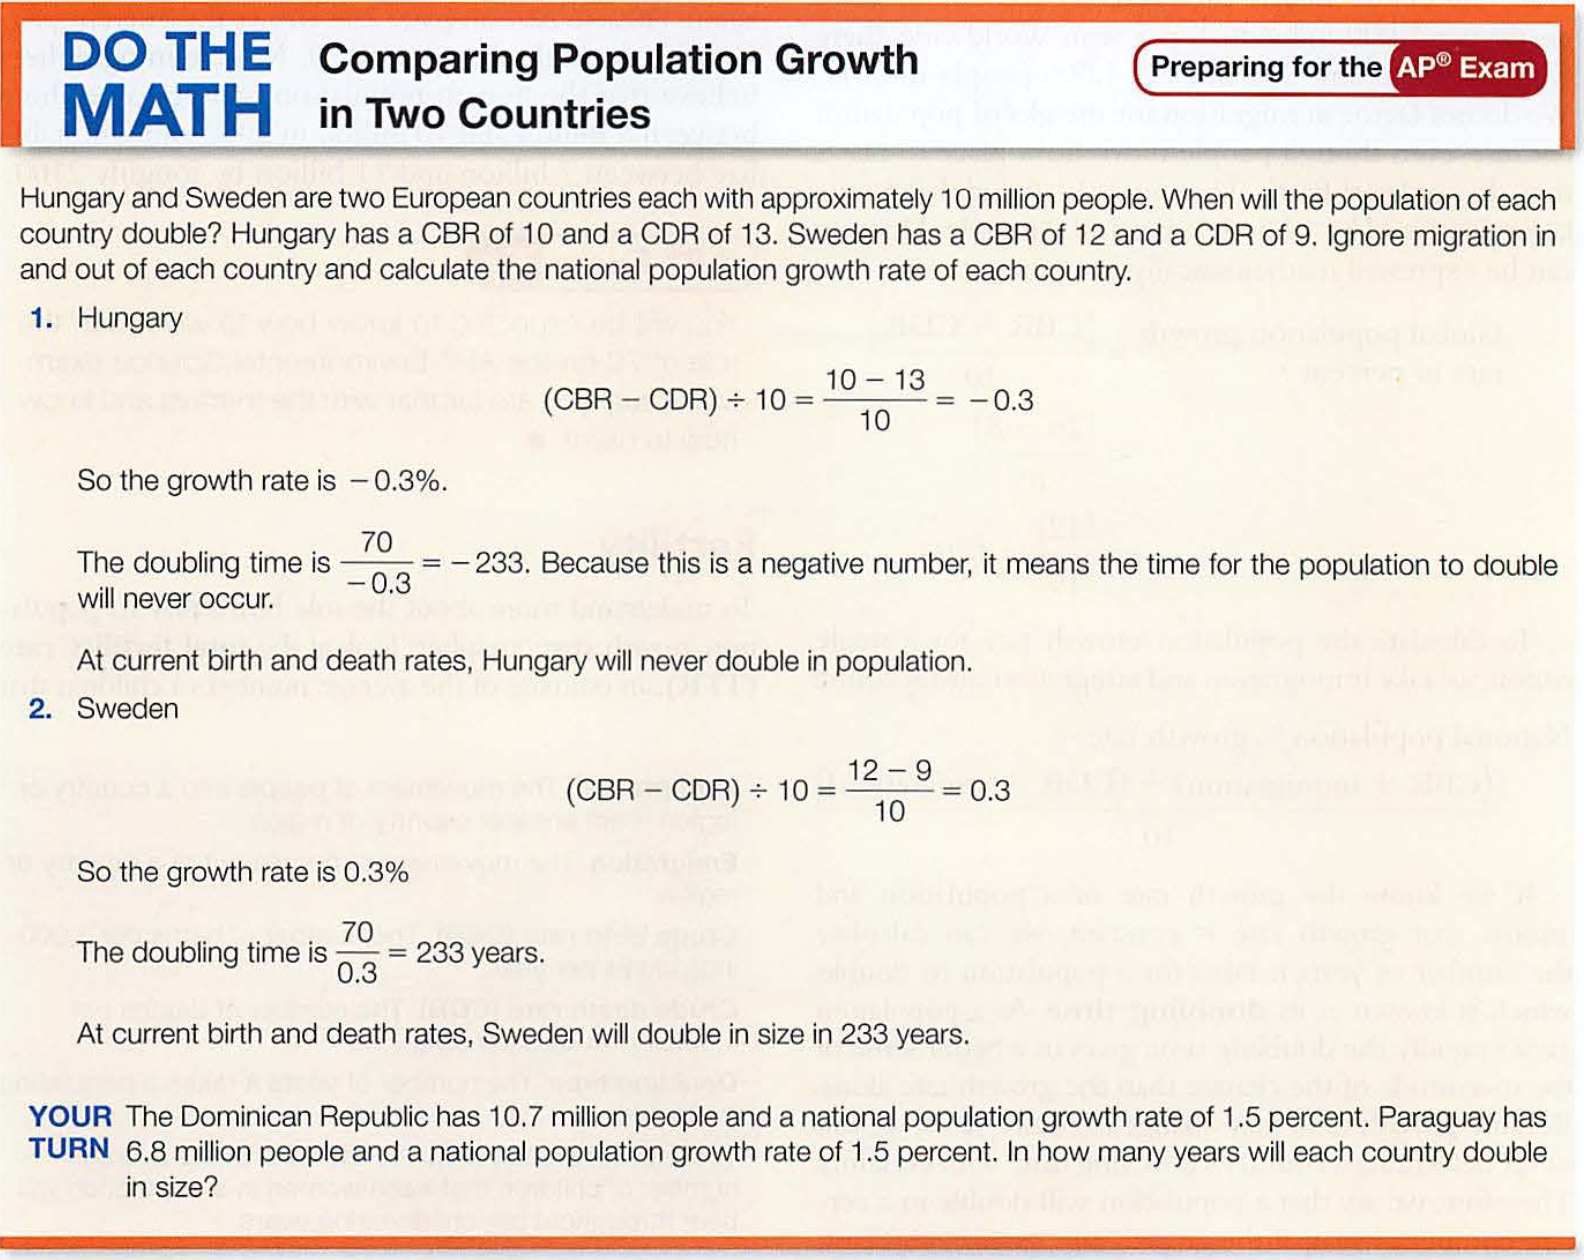
There is a very easy way to use this to calculate number of years for a population of ANYTHING to double:
70/% = number of years to double ("doubling time")
So, Doofania would take 70/7 or 10 years to double.
Watch:
70/3.5 = 20 years
70/14 = 5 years
On the AP exam, all questions will use a multiple or fraction of 7 (35, 3.5, 7, 14, 28, etc.)
Fertility: (also known as "fecundity")
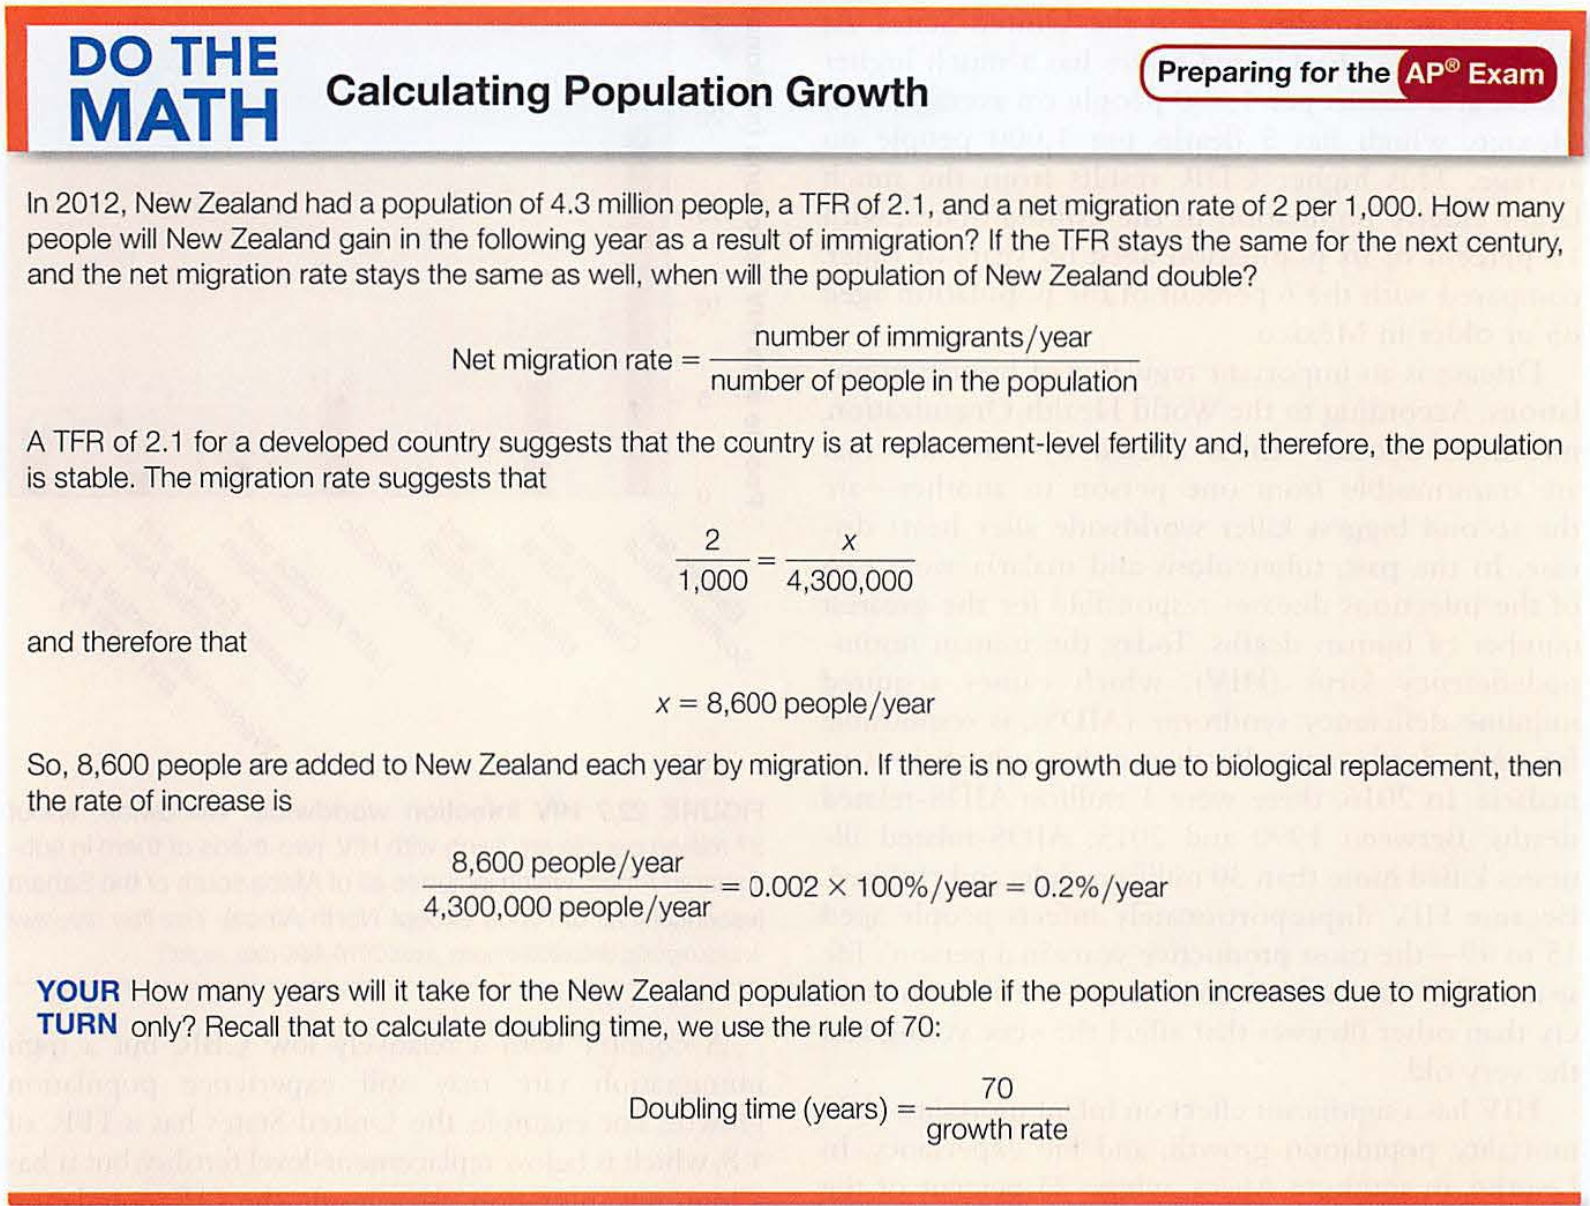
TFR is the total fertility rate, the average number of children each women will have.
n.b. TFR is not based on 1000 people like CBR and CDR, but is about EACH woman
TFR in the US was 1.8 a few years ago. This changed with COVID (why?)
Replacement level fertility: TFR needed to keep the population stable in a country
Where lifespan is short, TFR must be higher (war, famine, poor water, no food, no healthcare)
One reason families hundreds of years ago had many children (many did not survive to adulthood)
Present numbers are about 1.2 for TFR (some children don't survive, or have children themselves)
Screen Shot 2022-10-23 at 6.13.15 AM.png
LDC (lesser developed countries)
Look at the average lifespan distribution-what do you see?
Unavailable Apple Wiki media: the exported data did not include file 526a331a-8edc-4fa2-997d-ec1b95fbab24.
Men have shorter lifespans: war, work, testosterone, heart disease, smoking, cancer
Look up the life expectancy of men and women your parents' age
Compare with someone born in 1900
How many were farmers then?
Now compare the life expectancy image with this one: (infant deaths before age 1, child deaths under age 5)
One reason the one year birthday is such a big deal here in Hawaii
Unavailable Apple Wiki media: the exported data did not include file cb4b7df0-3cbd-4052-a3bc-3e8c4e159a4f.
Why?
clean water
health care
food supply
sanitation
lower pollution
Global IMR: 32
US: 5.8 Sweden: 2.5 Why? Not just about countries... US: 5.8 African American: 12 Native Americans: 7.6 Caucasians: 5.3
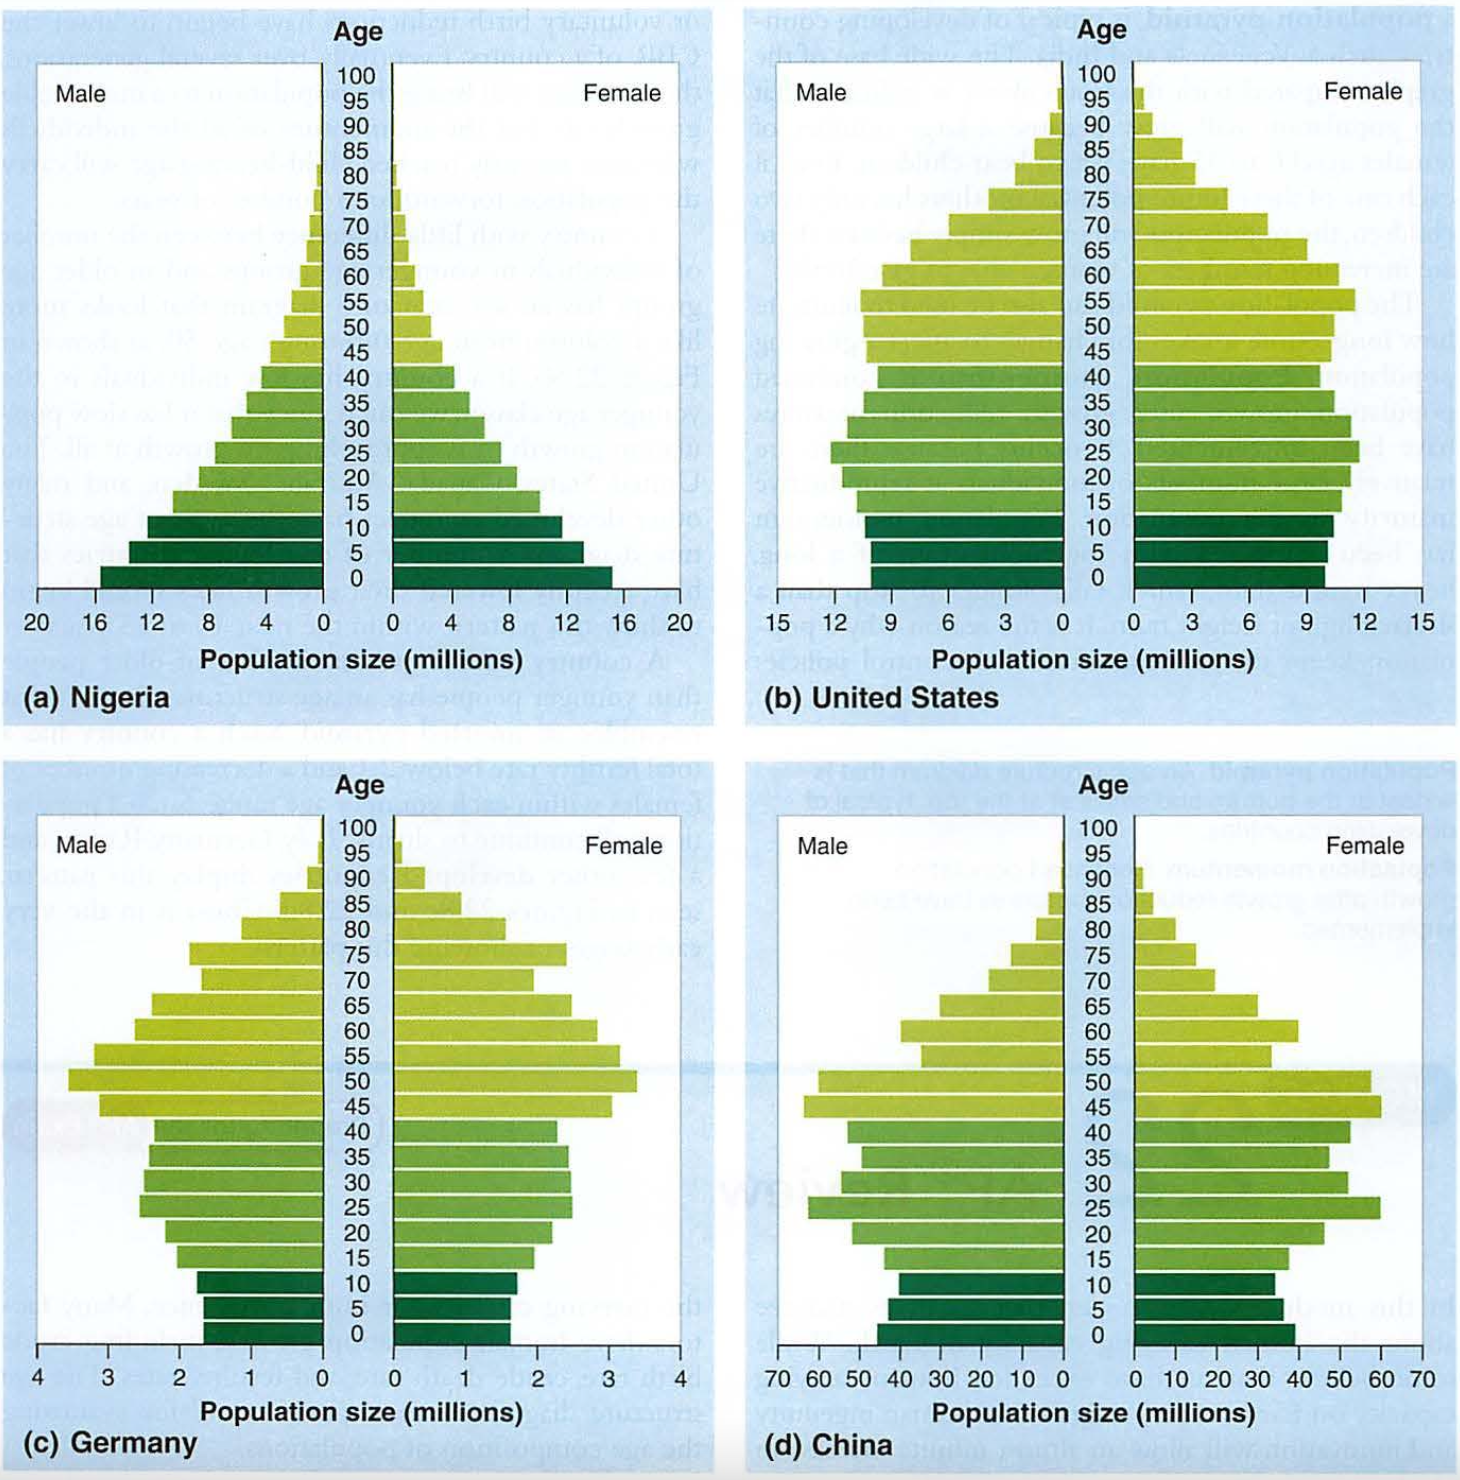
Go to 1950 and look at the US population. Look again in 1960. Where is the baby boom? Why were there so few babies born during 1940-45?
If you were a 42 year old American in 2000, when were you born? How old are your kids? Find the "boom echo".
Find the impact of the Iran/Iraq war of 1980-89, which side had the biggest impact? If you were a 35 year old Iraqi man in 1995, how old were you during this war?
If you are a 30 year old German man in 1950, when were you born? How old were you in WWII (1936-1945)?
If you were a 35 year old woman in Japan in 1960, why are there so few men to choose from?
Look at the UK in 1960. Where are the casualties of WWII, and are they both male and female? Explain.
What the heck is going on in UAE?
Look at Russia in 1960. What gaps do you see? Why?
Information about China is very spotty-why would this be? See if you can find the impact of the one-child policy from 1979-2021.
Compare present day Japan to Africa. What issues will they need to address?
Look at present day Italy, Japan and Germany. What is common?
Compare present day India and China. What do you see?
Terms to know: Human Populations-----------------------------
Fecundity: the ability to reproduce
Fertility: production of offspring
CBR: crude birth rate: births per 1000 people
TFR: total fertility rate: total kids per woman in her lifetime (25-30!)
ZPG: zero population growth: 5+ where infant mortality is high, 2.1 is normal
China: was 6 -> 1.8 (below replacement level since 1979, one child policy)
China has a 140/100 male to female ratio: why?
Global TFR is 2.6
CDR: crude death rate: deaths per 1000
Why is there a life span? mitochondrial DNA...
1900 Indian man had life expectancy of 23! Trace this to now...
Not now, reasons: nutrition CLEAN WATER, sanitation, education
75 men, 85 women (testosterone, war, "hold my beer and watch this!", Darwin Awards)
Dependency ratio; baby boomers and your future: how many workers to retirees
imagine your life at your age in other countries...
Russia low TFR: alcoholism and antibiotic resistant Tuberculosis
Migrated from Apple Server Wiki. Original page ID: J618L03